Note
Click here to download the full example code
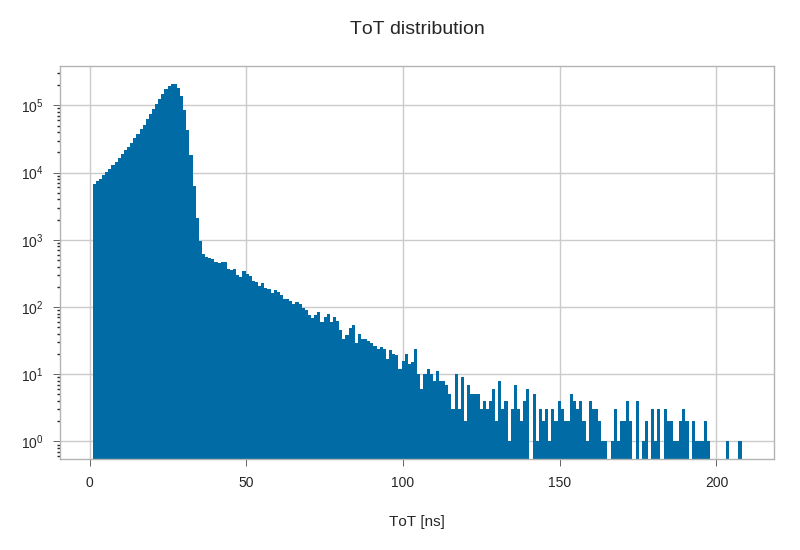
ToT histogram.
Create a simple histogram of the PMT signals (ToTs) in all events.
Out:
Loading style definitions from '/home/docs/checkouts/readthedocs.org/user_builds/km3pipe/conda/stable/lib/python3.5/site-packages/km3pipe/kp-data/stylelib/km3pipe.mplstyle'
from __future__ import absolute_import, print_function, division

# Author: Tamas Gal <tgal@km3net.de>
# License: BSD-3

import tables as tb
import matplotlib.pyplot as plt
import km3pipe.style
km3pipe.style.use("km3pipe")

filename = "data/atmospheric_muons_sample.h5"

with tb.File(filename) as f:
    tots = f.get_node("/hits/tot")[:]

plt.hist(tots, bins=max(tots), log=True, edgecolor='none')
plt.title("ToT distribution")
plt.xlabel("ToT [ns]")
Total running time of the script: ( 0 minutes 1.632 seconds)