Note
Click here to download the full example code
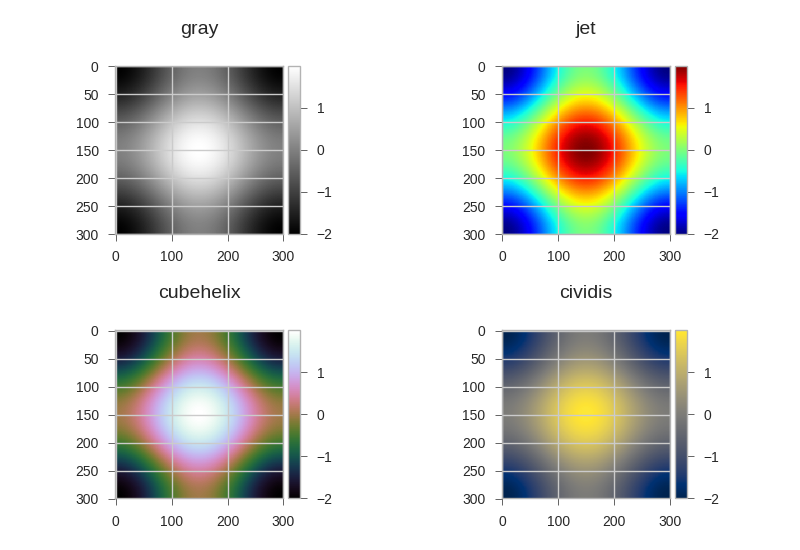
Colormap pitfalls.
Choosing the right colormap is important. A bad colormap like jet
(standard in ROOT and matplotlib < 2.0) fools you into seeing structure
where there isn’t any.
Out:
Loading style definitions from '/home/docs/checkouts/readthedocs.org/user_builds/km3pipe/conda/stable/lib/python3.5/site-packages/km3pipe/kp-data/stylelib/km3pipe.mplstyle'
from __future__ import absolute_import, print_function, division

import numpy as np
import matplotlib.pyplot as plt
from mpl_toolkits.axes_grid1 import make_axes_locatable
import km3pipe.style
km3pipe.style.use("km3pipe")

x = np.linspace(-np.pi, np.pi, 300)
xx, yy = np.meshgrid(x, x)
z = np.cos(xx) + np.cos(yy)

fig, axes = plt.subplots(2, 2)

for ax, colourmap in zip(axes.flatten(),
                         ['gray', 'jet', 'cubehelix', 'cividis']):
    ax.set_title(colourmap)
    im = ax.imshow(z, cmap=plt.get_cmap(colourmap))
    divider = make_axes_locatable(ax)
    cax = divider.append_axes('right', size='7%', pad=0.05)
    cbar = plt.colorbar(im, cax=cax)
Total running time of the script: ( 0 minutes 0.225 seconds)